Pack · Source
Explain Figures
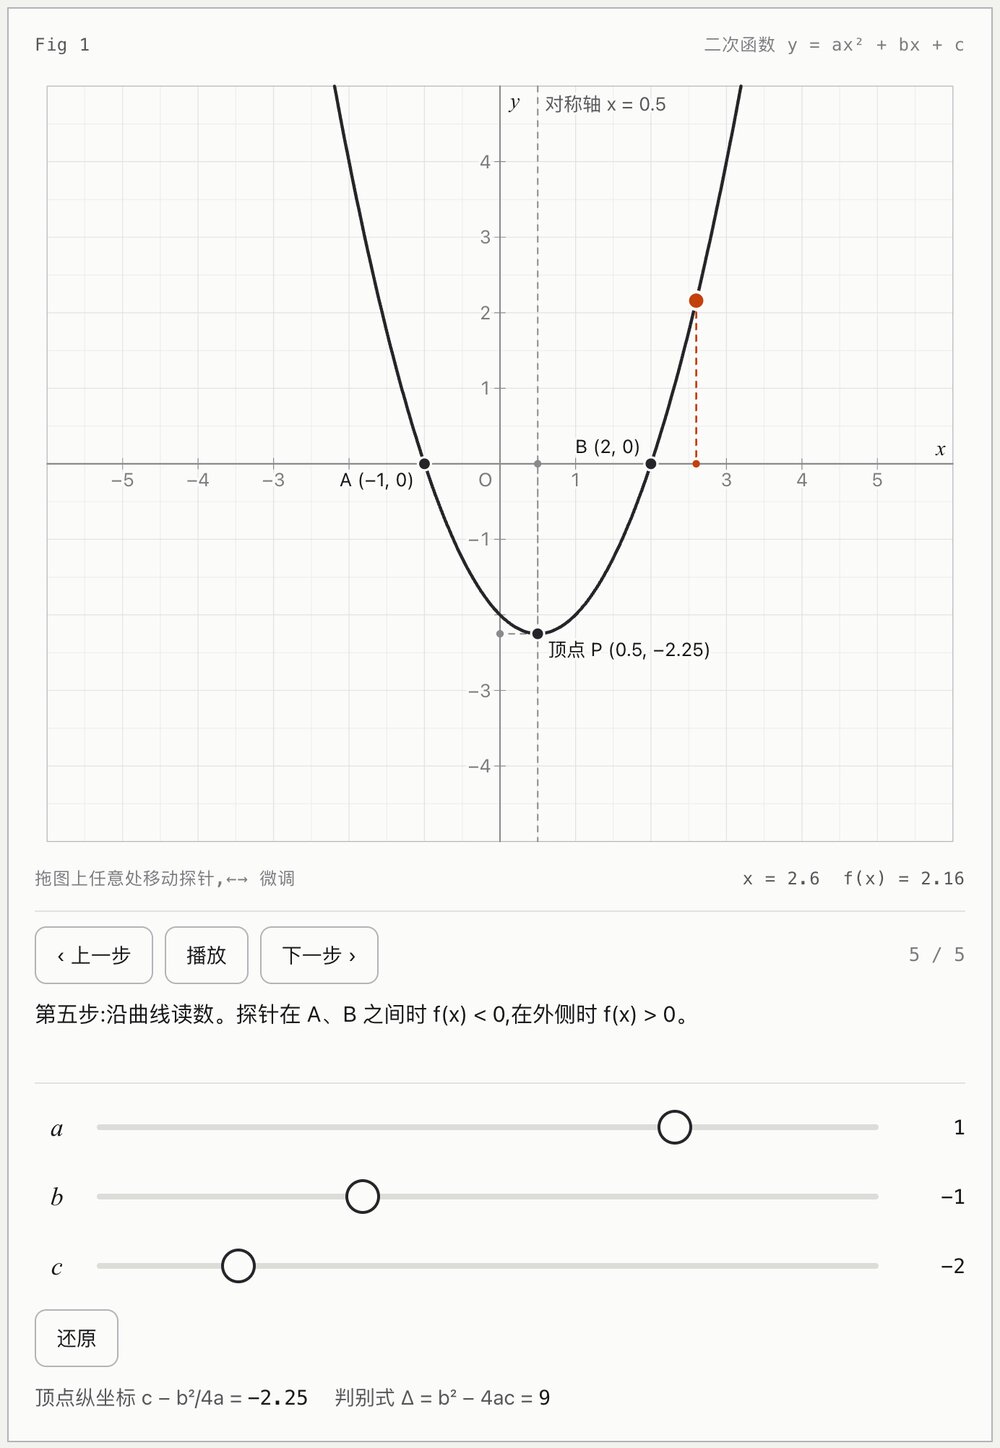
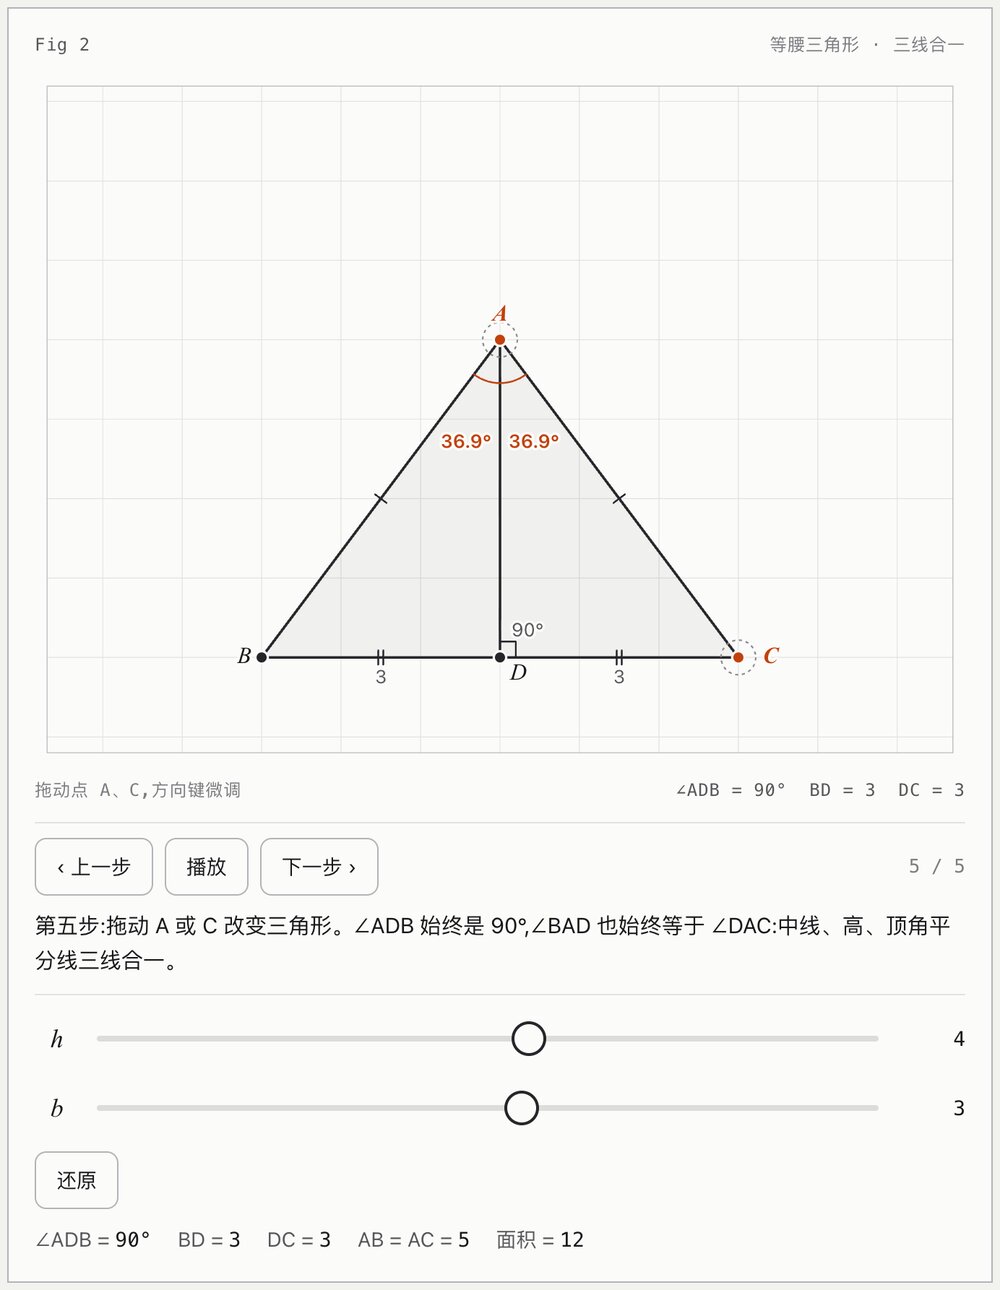
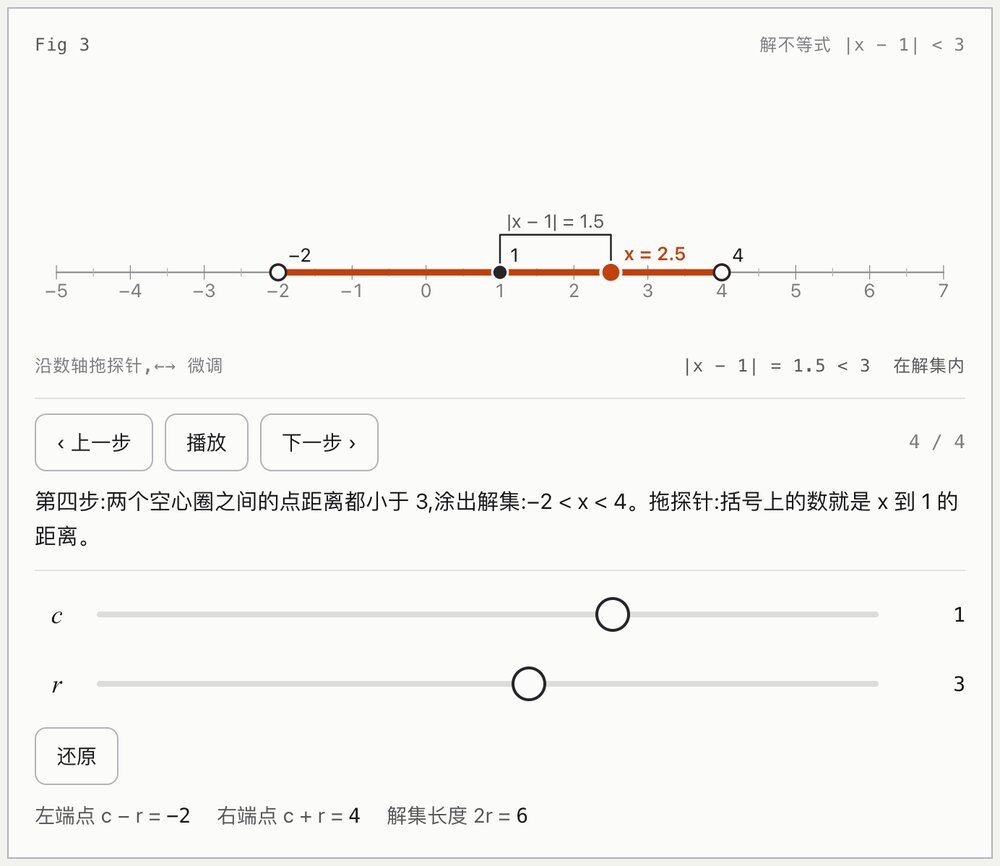
Three interactive maths figures for the web: function graphs, geometry and number lines, each with step-by-step animation and controls that really work. Pure ESM, no dependencies.
What it does
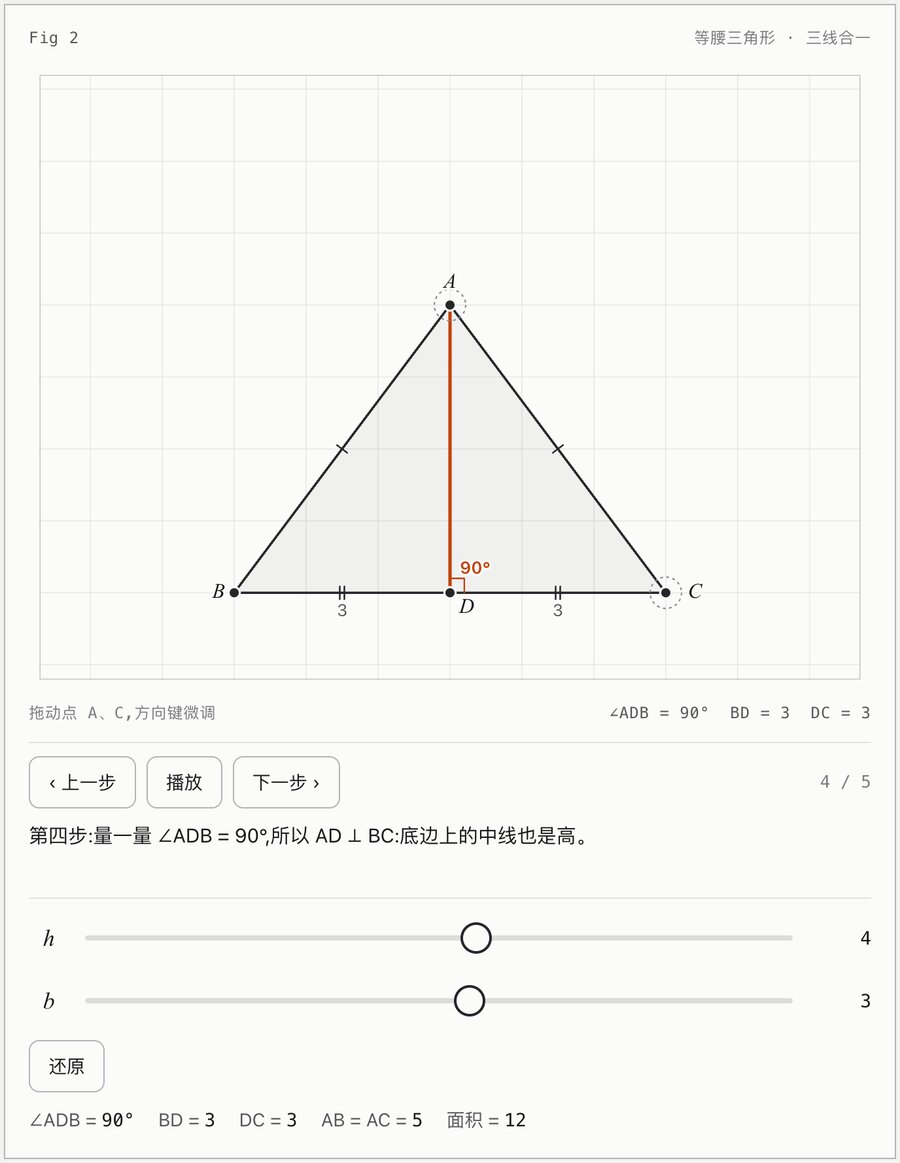
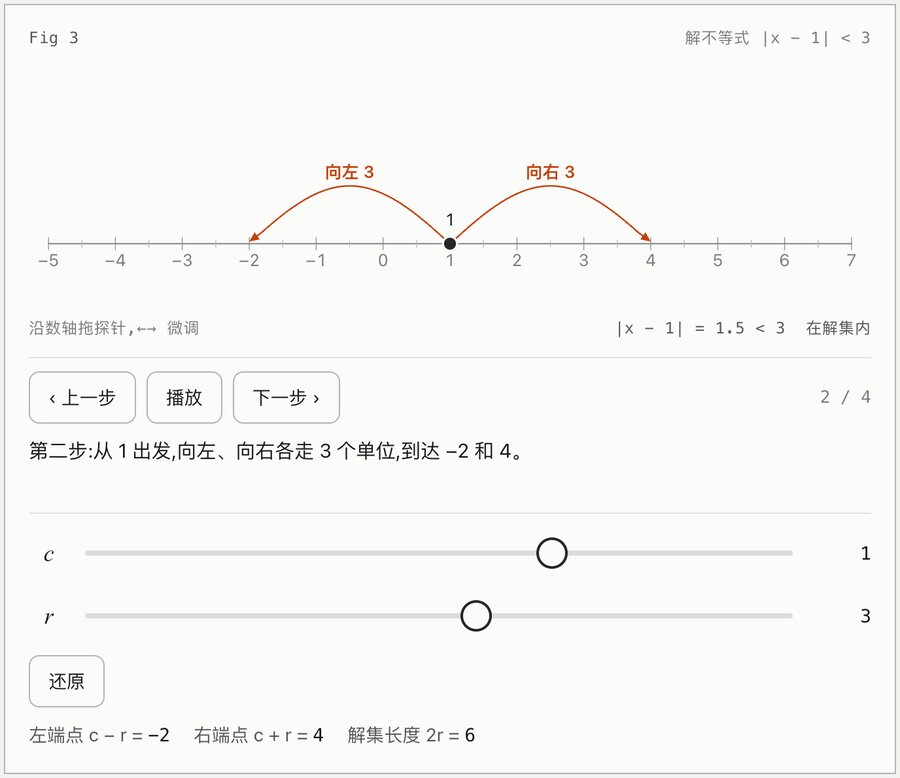
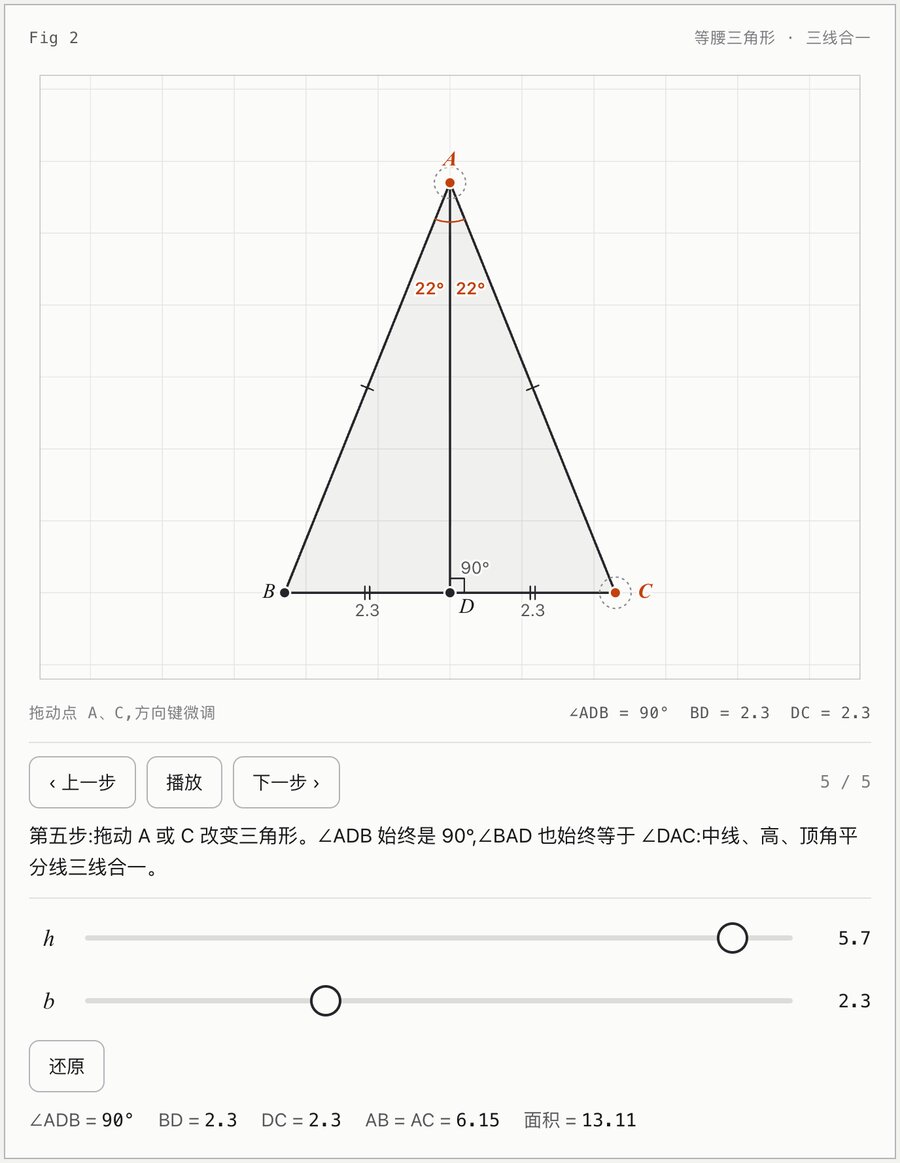
- Three kinds of figure: function graphs with a grid, curves, labelled points and guide lines; geometry with draggable points, angle arcs, right-angle marks and equal-length ticks; a number line with intervals, absolute-value distances and shifts.
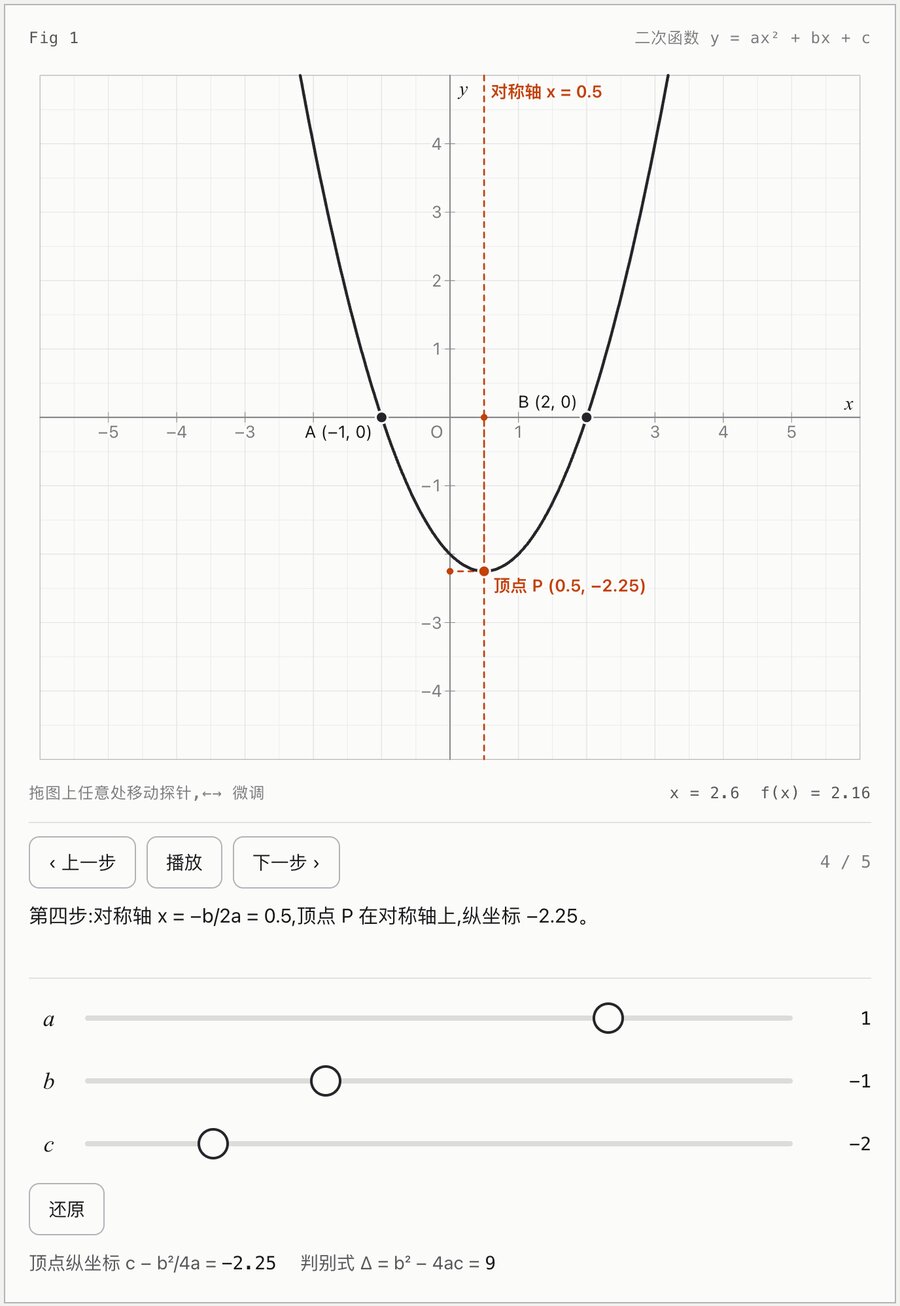
- Each figure explains itself in steps: parts appear and light up one at a time, it plays on its own or you step through, and the caption follows the current parameters.
- Real controls: range sliders, a probe you drag along the curve or the axis, a reset button and live readouts.
- Follows the system's light or dark mode, and stays readable on a 390 px phone screen.
Try it
Formats in the pack
- SourceIncludedexplain-core.mjs plus the three templates (explain-plane, explain-geometry, explain-numberline), all pure ESM with no dependencies; three demo pages that open with a double-click; three spec examples; SPEC.md with the full field table; README and LICENSE.
- New templates join the pack as free updates for owners.
- Templates
- Function graph, geometry, number line
- Code
- Pure ESM, no dependencies, no build step
- Demos
- 3 pages, open with a double-click
- Display
- Light and dark, readable at 390 px
Step by step
Licence
Commercial use is fine, including modifying the code and embedding it in your own or your clients' sites, apps, courseware and videos. You may not resell or redistribute it as a component, template or asset pack. Non-exclusive. Attribution is optional ("Figures by compreel.com").
More effects and packs
 Effect № 010:04 · 1920×1080
Icon Cloud Intro
Open source A 4-second launch intro, free and ready to use: your app icon at the centre, 44 soft-3D objects fly in from the lens, form a grid, rush back at the viewer and land on your product name. Openers · Canvas 2D · After Effects · Blender Pack № 0116 items · 128px 256px 512px 1024px
Soft Clay Infra Icons
 Pack № 0354 items · 128px 256px 512px 1024px